Authored by Chris Hamilton via Econimica blog,
As we near 2021, I offer a primer on where we stand demographically heading into the new year...
To begin, I'll divide the world into two roughly equal groups, consumers and non-consumers, using the World Bank gross national income per capita.
"Consumers" are half the worlds population, have average income per capita above $4,045...enjoy 80%+ of the income, savings, access to credit and likewise consume 80%+ of the worlds exported commodities and 80%+ of the worlds energy. They have average income of $12,000'ish. Consumers include:
-
83 High Income Nations ($12,536+) - EU, US/Canada, Japan, Australia/NZ, Saudi Arabia/UAE, S. Korea, Taiwan, Israel
-
56 Upper Middle Income Nations ($4,046-$12,535) - China, Mexico, Brazil, Russia, Iran/Iraq, Indonesia, Argentina, Thailand, Colombia/Venezuela
"Low or Non-consumers", the other half of the worlds population, have average income per capita of a few hundred dollars to $4044...earn less than 20% of world income, savings, access to credit and consume less than 20% of all exported commodities and burn less than 20% of global energy. They have average income of about $1,200 a year...10x less per person among non-consumers than the average "consumer".
-
50 Lower Middle Income Nations ($1,036 to $4045) - India/Pakistan, Philippines, Bangladesh, Nigeria, Egypt, Vietnam, Ukraine, Honduras/Nicaragua/El Salvador, Bolivia
-
29 Low Income Nations ($1,035 and below) - Afghanistan, Haiti, Somalia, Yemen, Syria, N. Korea, Madagascar, Chad, Uganda
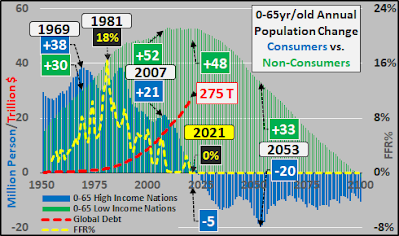
Critically, as you read through this and see large scale present and future population declines among the consumer nations...you will note that while there is growth among non-consumer populations, it is more typically on a 1:1 basis...meaning the decline of one "consumer" is being met with the replacement of one "non-consumer"...each replacement resulting in something like a 90% decline in consumption capability.
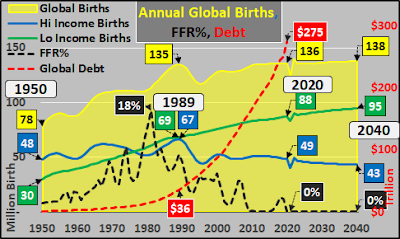
First, a look at the head waters of global demand...annual global births. The yellow shaded area in the chart below shows global births peaked at approx. 135 million annually in 1989...and have not likely ever returned to that high water mark. Although UN expected 2020 births to surpass the 1989 quantity...when the UN releases its next updated report, births will have been adjusted down by millions to reflect the reality demographers have been witnessing, putting births well below the 1989 peak. And in 2021, the dearth of global pregnancies in 2020 will turn into one of the largest birth dearth in history.
Family formation and resultant births is the greatest force in creating growing demand (inflation). UN data shows that annual "consumer" births (blue line, below) have declined by 18 million from the 1989 peak back to the same number of births as were seen in 1950. A full roundtrip, with 4 decades of rising births followed by 3 decades of declining births. These consumer nation numbers are generally inclusive of the births to immigrants within the consumer nations...absent that, the decline would have been much steeper. Low consumer nation births (yellow line) have risen by the same quantity as consumer nation declines. Both are expected to maintain their current trajectories...Low consumer births continuing to replace consumer births 1:1.
For those paying attention, inflation (as represented by the Federal Reserve set Federal Funds Rate) has been declining nearly in tandem with the declining consumer nation births, and global debt has blasted off inversely...with the impact of pulling demand forward against a future with organically declining demand. The question here, how would an ever smaller future of consumers pay off or outgrow ever more debt???
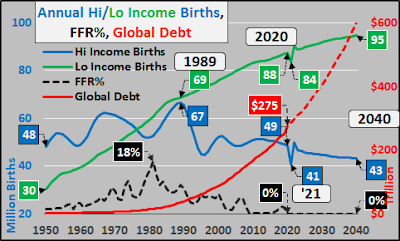
Narrowing in on high income nation births versus low income nation births...Not hard to see where this is going.
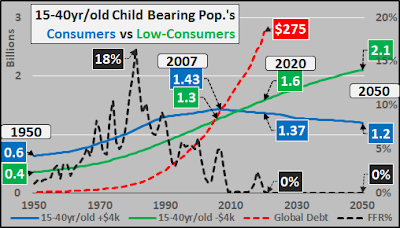
Given 30 years of declining consumer nation births, no surprise the childbearing population among consumer nations is now in decline versus ongoing growth in the low consumer nations childbearing population.
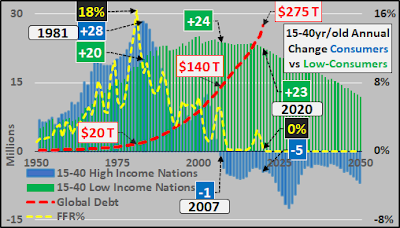
Below, checking the year over year change of the high versus low consumer populations. The acceleration and deceleration of the "consumer" childbearing population (essentially mirrored by the Federal Funds Rate), note the apex of growth among low consumer nations has come and gone. Declining consumer nation childbearing populations and decelerating childbearing growth among low consumer nations is all we can expect from here.
And the demographic flow through means the apex of the 0-65 year old consumer nations population has just been reached, and continued declines are to be expected from here. Again, the consumer declines are anticipated to be offset by low consumer population growth (much of the anticipated growth to be significantly longer low consumer nation lifespans leading to larger elderly populations...while growth among low consumer younger populations decelerates).

Again, checking the year over year change that is now turned to consumer nations secular depopulation and decelerating growth among low consumer nations.
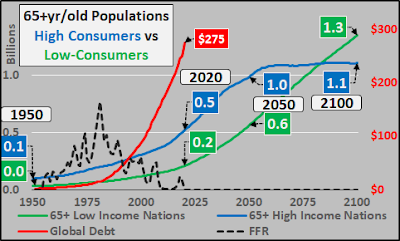
To round out the picture, 65+ consumers versus 65+ low consumers.
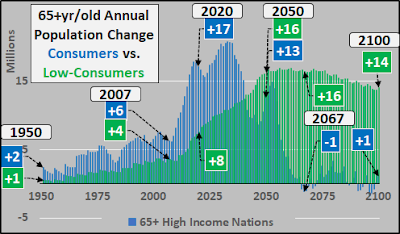
Year over year change in consumer vs. low consumer 65+ year old populations.
USA
Births
Despite all the US population growth and immigration, the US has only marginally exceeded the 1957 peak in annual births in a single year, 2007. And since that dual peak in 2007, births have again fallen by nearly 700,000 (-16%) fewer births annually. However, the imminent 2021 Covid-19 induced waterfall event in births will see 1+ million (-26%) fewer births than the '57/'07 dual peaks. Among major influences on the birth rate is the Fed's FFR% and asset purchasing resulting in large asset inflation essentially punishing young adults whom have few to no assets. Expenses rising well ahead of incomes. Resultant lower marriage rates, births are an outflow of Federal Reserve policy.
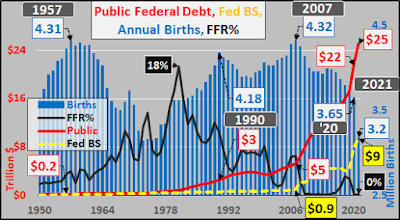
Below, a simple birth to debt ratio to gauge the creation of all that debt against the future responsible for outgrowing, repaying, and/or servicing that debt. The curve of falling births and exploding debt has gone parabolic.

Working Age Population
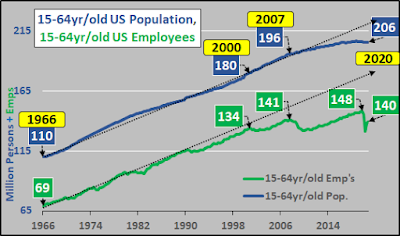
To wrap it up, check the 15 to 64 year old population (blue line) versus those employed among the same age group (green line). Shouldn't be hard to see the decelerating population growth and the even faster decelerating employment growth.
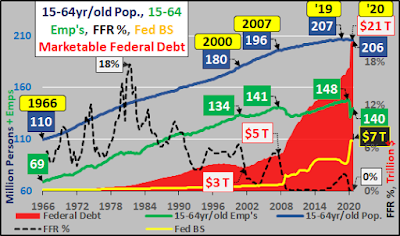
Same population/employment as above but adding in the Federal Reserve set FFR% and expansion of Federal Reserve balance sheet (QE)...and the impact of those policies to encourage greater federal debt.
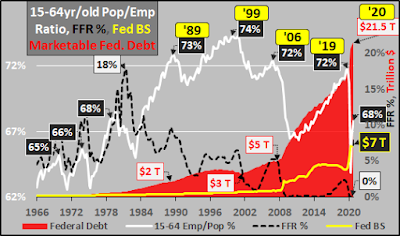
The Federal Reserve is tasked w/ stable prices (lol) and full employment. Below, you can see the means to achieve full employment has been ever lower interest rates, more QE, to encourage ever higher debt fueled economic activity.
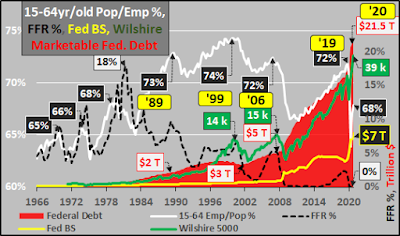
But if you add in the Wilshire 5000 (representing all publicly traded US equities), you can see quite clearly the primary winner of each progressive "full employment" cycle are not the employees but a shrinking percentage who hold a fast growing percentage of assets.
Housing
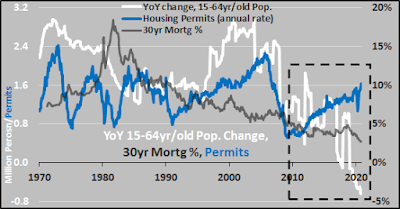
I'd be a bit remiss not to take a peek at housing. Below, annual change in the working age population (white line), 30 year fixed mortgage rate (grey line), and housing permits (blue line). What is taking place now has never happened as the Federal Reserve's interest rate setting and QE have pulled the 30 year fixed mortgage rates to record lows...while housing permits are being issued far in excess of the declining population of potential buyers. All this while the elderly population, with the highest homeownership rates, turn to net sellers as they downsize or leave inherited properties to their heirs. In all cases, a surge of housing units is coming for a declining basis of buyers.
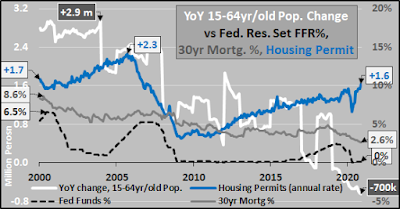
Looking a little closer at the same data as above, from 2000 to present.
Debt n Demographics
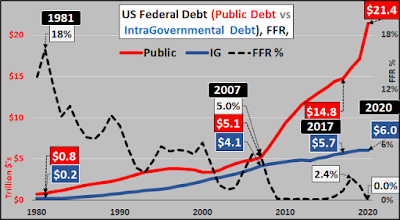
Quick review of US marketable public debt (red line), vs. Intragovernmental debt (debt held by SS trust funds, etc.), and Federal Funds rate. Essentially all debt issued from here forward will be marketable as the demographically driven IG rolls over to net declines. The US will be more reliant on foreigners, the Federal Reserve, and institutional buyers than ever before. This while the US government can afford essentially no higher interest payments than the present ZIRP induced reality.
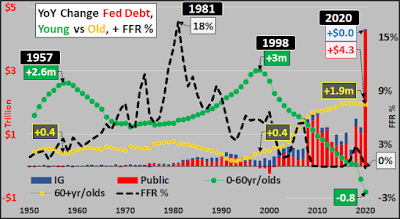
Checking the annual change in marketable (red columns) vs IG (blue columns) debt, likewise change in 0-60 (green line) vs. 60+ (yellow line) year old US population, and again the Federal Funds rate.
For those curious to see the relationship of lower rates and ZIRP (black line) to encourage soaring debt; below are total US debt/GDP (blue line), Federal Government debt/GDP (red line), and the resulting heavens bound Wilshire 5000.

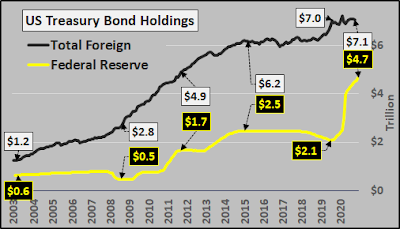
US Treasury Bonds
Below, Federal Reserve held US Treasury debt (yellow line) versus foreign holdings (black line). With so much more demographically driven issuance to come and so few buyers willing to buy US debt anywhere near current rates...the only natural buyer is a buyer whose motivation isn't profit but control. I'll bet the Fed isn't about to play the QT card again.
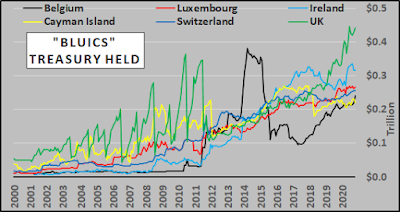
Comparing the soaring Federal Reserve held Treasury's to the largest holders of US debt; China, Japan, and the "BLUICS" compilation (Belgium, Luxembourg, UK, Ireland, Cayman Island, Switzerland). Despite running large dollar trade surplus', foreigners no longer recycle their excess dollars into Treasury's. But they must go somewhere...equities, precious metals, but perhaps particularly Bitcoin?

Only ongoing net buyer of US Treasury bonds are shadow banking nations with access to central bank swap lines rather than dollar based trade surplus'.
Short and long of it...US is in a demographic driven decline, the federal government is committed to growth at all costs, the Federal Reserve is tasked with ensuring US Treasury bonds are not traded at "free market valuations". And perhapsmay Bitcoin is the best way to short America?!?
Bitcoin
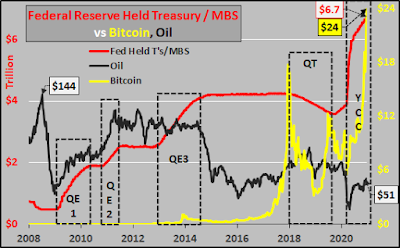
Finally I mention Bitcoin and just show it versus the Federal Reserve's combined holdings of Treasury's and Mortgage Backed Securities, plus the operations undertaken leading to an ever larger balance sheet. The flood of $'s and removal of large scale quantities of assets are pushing asset prices higher but the combination of cheap interest rates (are boosting long term capacity) while only offering short term boosts to demand, are pushing commodity prices ever lower. Make of this what you will.
Anyway, about now the nature of 2020, 2021 should be more clear...this is no typical business cycle or pandemic. Decades of demographic deceleration and now outright demographic declines are at the heart of central bank ZIRP/NIRP, QE, and soaring debt. Demographics are destiny and by now is should be clear there is no means to ever outgrow this debt. This appears to be the initiation of a global reset, de facto or otherwise.
To wrap it, at the conclusion of Fight Club, after having killed his alter-ego & arranged for the destruction of all global credit records...Ed Norton says, "You met me at a very strange time in my life" as the credit records are all destroyed. I believe the world is equally living a dissociated reality but will soon become painfully self aware of the truths we have so long disavowed.

Enjoy the clip...Fight Club
*Population data from UN World Population Prospects 2019.
