The bears are dead. Long live the bears. And that, in a nutshell, describes every bubble and emerging bear market there ever was. There is no doubt that the recent market environment has been unrelenting in terms of its unidirectional focus. Yet it is precisely the very market environment bears wanted: Exuberant markets, markets highly stretched above historic moving averages, complacency everywhere and capitulation toward the upside at a time when stocks are the most expensive in many years.
Consider: Not only is the $NDX on its 9th year of consecutive up, but also on its 7th consecutive up week in 2017 (in fact it hasn’t had a single down week in 2017 as of this writing) and on it’s 9th consecutive day up in February.
Yet I’m calling for a coming bear market here at $SPX 2351. This market, while perhaps still going higher, is setting up not for a correction, but a major bear market. And mind you this can grind around for a while. Tops are processes and not events.
And let’s be upfront: I’ve not liked the structural backdrop of markets for quite some time, but have been cognizant of its technical apex potential. The blow-off top scenario if you will (see Media). The reason why is plain: The entire global financial system is 100% dependent on central bank intervention and debt expansion and low rates. There is zero evidence that markets can organically support current assets prices anywhere in the world without any of these things. I’ve outlined my structural concerns in detail in the Market Analysis section in the past and you can read up on them there.
Case in point: 2016, starting off with a sizable market correction, saw the most central bank intervention ever in a coordinated global central bank panic response. With the additional free money promises of “phenomenal” tax cuts, deregulation and infrastructure spending following the US election the perfect trifecta of price acceleration commenced: A continued easy Fed supported by global central banks adding $200B in artificial liquidity per month, continued massive buybacks and promises of more free money which is certain to increase the ever ballooning global debt balloon that hit over $152 trillion in 2016. With no end in sight.
The intervention game is self evident:

Yet this chart, and others, reveal the very seeds of the next bear market. While bulls are celebrating a temporary jump in earnings let me caution that this jump in earnings came again on massive levering up throughout the economy continuing the trend that has been going for years.
Here’s the reality everyone seems to be in complete denial about: When, not if, the next recession hits the world will have to face it with record government, corporate and consumer debt and pension funds severely underfunded. As far as markets are concerned it appears we are repeating again the cycles of the past major bubbles. Extreme high valuations, extreme high debt and absolutely no fear or concern of anything ever getting in the way. Indeed the current volatility compression is the most extreme in market history rivaling only the beginning of 2007. Now let’s deregulate the banks and unleash them back on consumers seems to be the political wind that’s blowing.
And so global markets are repeating exactly the same mistakes again. As in past bubbles folks that abandon any notion of risk look like geniuses and those that are cautious look the fool for not playing along or trying to fade the mania until they finally capitulate, usually at the wrong time. It’s a nasty psychology, but so it goes.
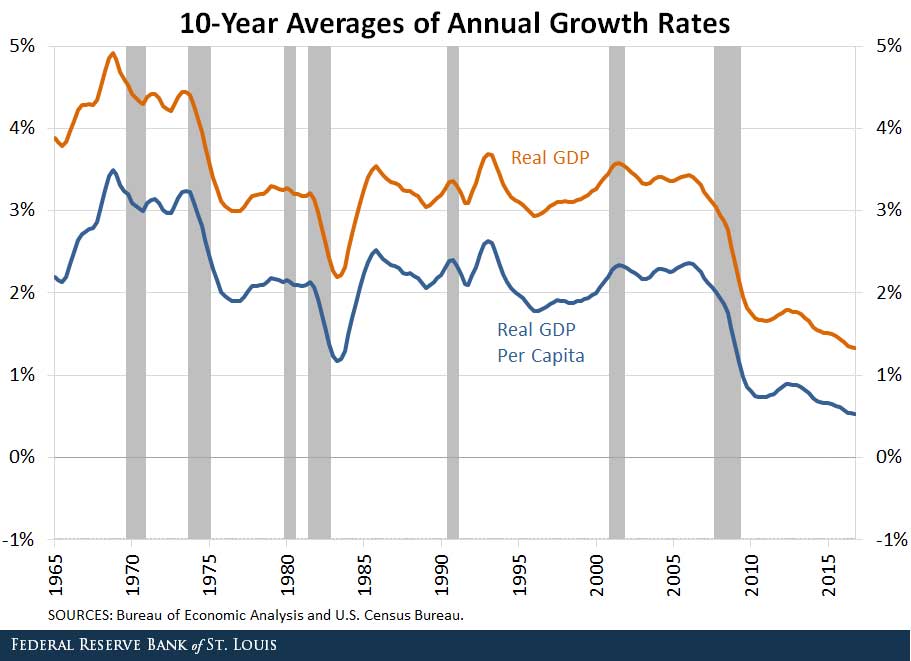
Yes we can claim growth if people pile into car loans, or move into record credit card debt or if governments continue to run high deficits. All of this was what was required to record paltry GDP growth in 2016. Indeed, it is record debt expansion and central bank intervention that masks the structural ghosts of technology and demographics which are at the core of the problems. And so now, after 8 years of relentless accommodation Janet Yellen was forced to admit today:
“Economic growth has been quite disappointing”
You think?
Yet markets haven’t cared about any of it so far as they are focused on the next carrot. Free money.
Last week and this week we saw markets again buying every free money promise by the new administration hook, line and sinker. I’ve been on the record stating that the fiscal realities will cause a rude awakening (Empty Promises).
As of this weekend even Goldman Sachs seems to start agreeing with my position:
“a large fiscal stimulus will be difficult to achieve in light of fiscal constraints.”
Right.
I’ve been very clear that I sense all these free money promises are marketing fantasies the reality of which will come back to haunt those that bought into the fantasy.
And I’m not alone in this assessment. Here’s Cowen & Co:
“A warning to investors sending stocks to record highs: President Donald Trump’s “phenomenal tax plan” probably won’t be so great.
That’s according to Chris Krueger, an analyst at Cowen & Co., who wrote Monday that bulls are bound to be disappointed after Trump’s hint last week that he was close to announcing a corporate tax overhaul helped send stocks to a three-day rally. Instead of a “bigly comprehensive tax policy paper,” Krueger said what’s more likely is:
- “A puff piece with a lot of adjectives;” or
- A vague mention of tax reform during Trump’s address to congress Feb. 28; or
- An executive order directing the Treasury Department to come up with a plan.
“You should not study his policy statements (or when his staff clarify/clean-up) with Talmudic concentration,” Krueger said in a note. “Trump’s White House is non-linear and non-consistent by design.”
And what is the core of this fantasy? That tax cuts and deregulation will suddenly spur real economic growth that was withheld from the world for the past 30 years? Please. The truth is effective corporate tax rates are at the lowest levels they have ever been:
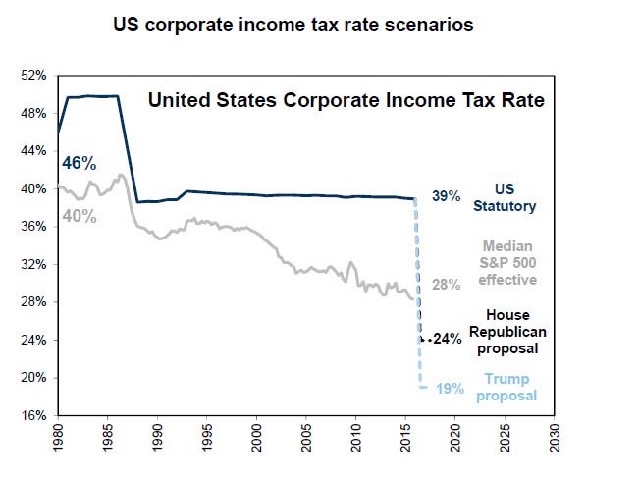
And they have declined steadily for decades. And this very decline has been accompanied by ever higher debt and ever lower real GDP growth. While lower taxes here will add to the wealth of the top 1% yet again it will not magically change the structural picture because it hasn’t in decades.
Has anyone seen a budget with line items? If we see one I suspect it may come with a revenue growth multiple fudge factor of x, but let’s be clear, the notion of tax cuts being deficit neutral are highly unlikely.
The US government will officially reach the $20 trillion debt mark in the next few weeks. Be sure there will be headlines about it left and right and just in time for the debt ceiling limit to be reached and becoming a front and center policy discussion on March 15 at the latest. And right then and there the folks in power have to reveal what they intend to do. And frankly this is a process that can take months into the summer as all kinds of accounting tricks will be used to keep the government running. But they have to make a decision.
And they know:
“We know we’re going to have to pay for this,” said Sen. John Cornyn of Texas, the No. 2 Senate Republican. “The question is whether we do it now or whether we send it to our kids and grandkids and make them pay for it. So that’s an important point that we need to achieve some consensus on.”
The question is whether Donald Trump knows this as well and inherently there is a conflict between the narrative and the reality:
“Trump’s tax cut, estimated to cost almost $5 trillion over 10 years, looks sure to be pared way back. Top lawmakers like House Ways and Means Committee Chairman Kevin Brady, R-Texas, and No. 3 Senate Republican John Thune of South Dakota say the GOP’s tax plans shouldn’t add to the deficit. That would mean tax rates couldn’t be cut nearly as sharply as Trump wants.”
In fact the rift is so large that Fink has prompted to send this warning on Friday:
Trump administration poses risk to global government debt — Fitch
“The ratings company said a less stable US could cause a slew of issues, including “disruptive changes to trade relations” and “exchanges between policymakers that contribute to heightened or prolonged currency and other financial market volatility”. “The materialisation of these risks would provide an unfavorable backdrop for economic growth, putting pressure on public finances that may have rating implications for some sovereigns,” Fitch added…….In Fitch’s view, the present balance of risks points toward a less benign global outcome”. The sovereigns most at risk would be those with “close economic and financial ties with the US that come under scrutiny due to either existing financial imbalances or perceptions of unfair frameworks or practices that govern their bilateral relations”, Fitch said. Among the countries that Fitch pointed to were Canada, China, Germany, Japan and Mexico, but “the list is unlikely to end there”.
So there is no clarity what will happen in terms of actual policies or trade-offs. I’ll leave that for others to discuss, but what I will say is that the charts have produced what one may consider to be upside capitulation while the underlying picture remains horrifically weak.
Indeed troubling signs are popping up everywhere if you look closely:
Tax receipts are not showing signs of a largely expanding economy:

And gross private investment has been lagging severely. Without investment future growth will be tough to come by.

Yes one can use the odd corporate announcement as a marketing tool here and there, but the larger structural realities are what they are.
On the consumer front here’s the issue I see: It’s all debt driven again and pushing people into loans that will hurt them as affordability will become an issue. Retail is being pushed into expensive auto leases at unprecedented levels for example:

Recent real wages data once again disappointed and when you have a spike in inflation it messes with the affordability of things in a big way:

So I’m sorry, but structurally we are again doing the same things that got us into a big mess before: We fly on debt, we let the banks loose and we push retail into bad loans and into things they can ultimately not afford.
Meanwhile we see evidence of banks loan standards being tightened for consumers:

…which is also reflected in stalling loan growth:

So what’s been driving the momentum into stocks here? It’s actually an easily understood trifecta. While we had central banks and buybacks in markets over the past few years the election of Donald Trump with promises of tax cuts, deregulation and infrastructure spending made it a trifecta: Folks piling in long as they are smelling free money. Add to the fact that we are in a seasonal strong period strength and earnings have come in with some growth versus last year strength shouldn’t surprise.
What also shouldn’t surprise is the fact that there is low volume. This has been the cornerstone of every single large rally over the past several years. As organic buyers disappear at higher prices it is algos and the price insensitive buyers, the ones that have no personal stake in the outcome of a long buy at any price, that are dominating the landscape and they are buying till the damn breaks technicals be damned.
Last week on CNBC Fast Money I pointed to one of the charts speaking of the number of stocks above their 50 day moving average deteriorating, a pattern similar to what we saw in the summer of 2015 and in 2007.
Here’s the clip, and that includes the comedy bit at the end when the time delay caused a mix up in communications as we wound the segment up. Hey if you can’t laugh at yourself…..
But the larger technical point is this: While we see complete capitulation to the upside in certain stocks and sectors we see serious weakness beneath.
Indeed most of the new highs coming this week came on negative advance/decliners.
The equal weight chart keeps waving red flags:

Let me highlight several key concerns on the technical front.
The weekly $XIV, the inverse of the $VIX shows historically unprecedented capitulation to the upside. Previous moves of lesser extremes have produced reversions to the lower Bollinger Band:

The $NDX is not only on year 9 of consecutive gains, on 7th consecutive weekly gains in 2017 (every week is up) and on its 9th consecutive day up in February. The consequence of all this? The $NDX is now over 18% above its annual 5 EMA:

Further signs of excess: $NDX 11% above its 200 MA. Daily RSI 79.30 #5266 $AAPL 25% above its 200 MA. Daily RSI 90.43 $136.
And have a look at the structure of $MSFT, not only following a similar path of the 200 bubble days, but also showing a massive disconnect from its quarterly 5 EMA:

Not to mention the upside crashes we just witnessed in the financials led by $GS:

So it remains a rally of the few which are historically extended while the many are showing weakness.
Finally, however, also let’s not forget the larger context: Stocks are PRICEY, indeed the multiple expansion over the past few years has been breath taking on many measures running about 17%-25% above the long term mean.
You get my drift: Just a reversion to the mean and/or technical reconnects imply sizable down moves to come, implying at least 20-30% correction just to reconnect with long term technical averages.
We haven’t had a sizable correction approaching 20% since 2011.
But besides the structural and technical concerns there may be another one to be concerned about.
Consider this sentence:
“By the spring of 2017, production, profits, and wages had regained their 2009 levels.”
That seems about right yes? Except I fudged the numbers. The original sentence:
“By the spring of 1937, production, profits, and wages had regained their 1929 levels.”
8 years after the 1929 crash the economy had recovered and then the economy experienced a downturn amidst a world turning to nationalism (in Europe).
Sound familiar? History may not repeat itself but it can rhyme.
Banks, profits and stock prices have recovered from the 2009 financial crisis. This recovery has come at a steep price however. Record debt, intervention and huge wealth inequality which has seeded the breeding ground for political movements of nationalism.
Now I may be stretching it here comparing 1929 to 2009 and 1937 to 2017, but it’s kind of ironic that we even see the numbers and charts align. Just look at the steady up move in the January and February of that year with one final spike higher in March of that year.

Obviously we are living in a very different world now, and 2017 can play out very differently, but still there are overarching similarities that may be too familiar to ignore completely.
None of us can know when and where this ends, but the notion of perpetual higher prices in a structurally low growth environment is not compatible with a happy ending no matter how much you try to artificially juice it. One may choose to believe recessions will never happen again, and one can choose to believe that ever expanding debt will be consequence free or that somehow we will just muddle through.
However the longer historical view reaches a variant conclusion: The central bank experiment has failed. Janet Yellen will never find a less volatile and calm market environment than now. Still she and her team could not bring themselves to raise rates by one measly quarter point in February. Instead she’s gone back to tinkering about uncertainty. January 2018 can’t come soon enough for her and I actually don’t blame her. Who wants to deal with the aftermath of the next bear market? Certainly not the enablers of its creation.
Folks are very optimistic right now and I can’t blame them as perpetually rising prices are infectious. But we have seen these movies before and sentiment is a fickle thing, it can change on a dime once price moves the other direction. And nobody will be more disappointed than those that were promised the moon and didn’t get it.
No, it does not appear we’ve learned a single thing. Except this time around we’ve indebted future generations with an even higher burden. In fact we doubled global debt in just 8 years. And now we have no choice but to add more or it all falls apart. And that is the core basis of the bear case. The world is trapped in a spiral it has created. And the casino needs consumers to keep spinning the wheel despite their pensions withering away and real wages not keeping up with emerging inflation. But don’t worry, we got phenomenal tax cuts coming. How will we pay for them? Oh trust us growth will be coming. Right.
So we say while this blow-off topping move may eventually extend into 2458 per my technical upside risk target we continue to view strength as a primary selling opportunity in 2017 as the next bear market is already programmed in the market’s excess. And so far it looks like we are getting plenty of selling opportunity in this time period between right here and March as it may prove to be a critical pivot time frame.
Why? Consider the following:
February 2016 was a major bottom, February 2007 was an intermediate top. March 1937 was a major top as was March 2000. And who can forget the major bottom in March of 2009? So there you have it, we are historically stretched toward the upside amidst historic compressed volatility while facing a potential key pivot time frame for markets. And be clear tops don’t happen suddenly, they can stretch out for months with volatility increasing as broad sell-off and counter trend rallies duke it out. I expect volatility to pop “bigly” ???? in the months to come.
As I said last week on CNBC, while we may squeeze higher, without a corrective move this price advance is getting more bearish by the hour as the energy compression will seek a natural release. The coiled spring scenario if you will.
We shall see. Good luck everyone. It’s going to be a fascinating couple of years.
