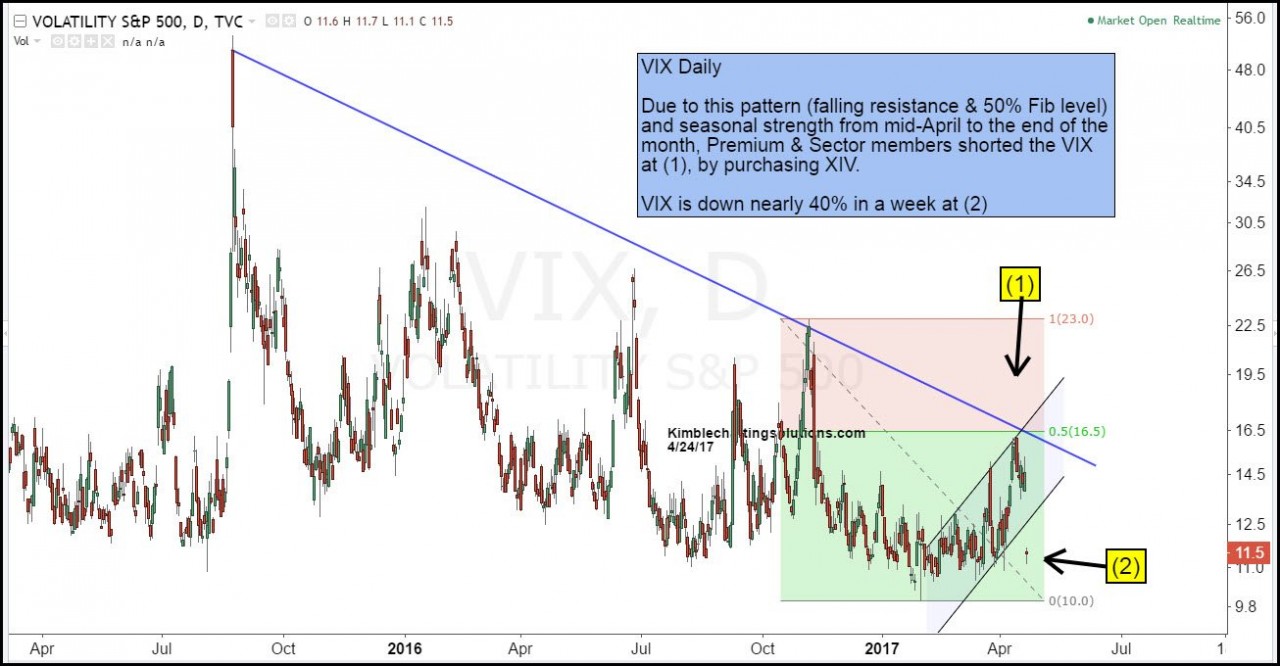
Below looks at the VIX (Fear Level) over the past few years. A rally had taken place in the VIX, driving it up to falling resistance and its 50% retracement level at (1), in the chart below.

CLICK ON CHART TO ENLARGE
We shared the chart above last week on Twitter last weekTwitter
getElementsByTagName(s)[0],p=/^http:/.test(d.location)?'http':'https';if(!d.getElementById(id)){js=d.createElement(s);js.id=id;js.src=p+"://platform.twitter.com/widgets.js";fjs.parentNode.insertBefore(js,fjs);}}(document,"script","twitter-wjs"); One of the reasons Premium and Sectormembers bought XIV, was due to this pattern and a seasonal pattern in stocks (strong the last two weeks of April). The VIX index is down nearly 40% in the past week, following hitting resistance at (1). Members this morning are pulling up stops to protect gains.
Go here to get started on a 30 day Free Test Drive to my Premium Research
Website: KIMBLECHARTINGSOLUTIONS.COM
Blog: KIMBLECHARTINGSOLUTIONS.COM/BLOG
Questions: Email services@kimblechartingsolutions.com or call us toll free 877-721-7217 international 714-941-9381