Ole Doc Copper has been creating a series of lower highs and lower lows since 2011. During this time period, stocks did well and many commodities did not. At the same time Doc Copper was soft, global growth had little to brag bout. Also during the decline in Doc Copper, interest rates did the same.
Around the time of the election, Doc Copper broke above a narrowing pennant pattern and buyers stepped in on the breakout, pushing Copper sharply higher. Below takes a current look at Doc Copper on a weekly basis
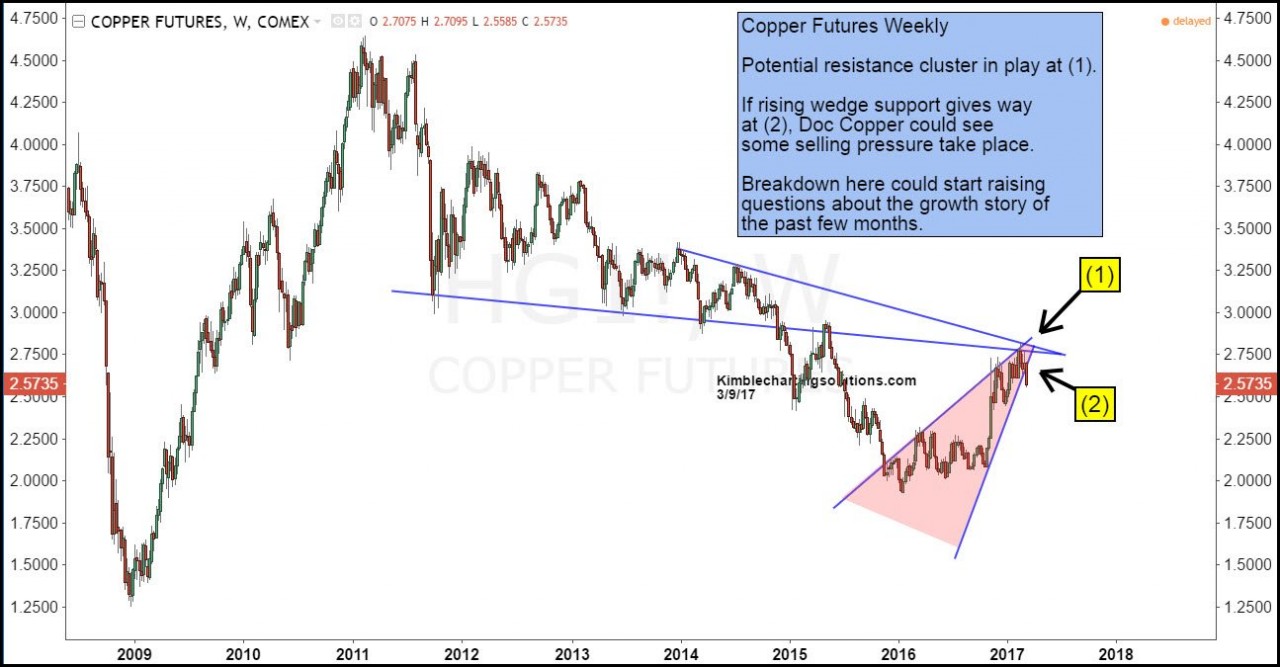
CLICK ON CHART TO ENLARGE

This sharp rally has taken Copper up to test two falling resistance lines, drawn off a series of lower highs at (1). At the same time Copper is testing falling resistance at (1), it also finds itself at the apex of a potential bearish rising wedge pattern. Two-thirds of the time, this pattern suggest lower prices.
The common theme/narrative post election is higher stocks, higher growth, higher inflation and higher interest rates. Currently Copper traders have established a historical crowded trade. If support breaks at (2), this crowded trade would find itself of the wrong side and considerable unwinding could take place.
What ole Doc Copper does at (2), could go a long way to proving, if the post election narrative/theme is still on this path.
Website: kimblechartingsolutions.com
Get our daily research posts delivered to your inbox here
Questions: Email services@kimblechartingsolutions.com or call us toll free 877-721-7217 international 714-941-9381