Ole Doc Copper has performed very well over the past 2-years, as it has rallied 50%. Maybe the rally has been sent a positive message about the worlds macro picture? Could have and maybe stocks liked it.
Below look at the price action of Doc Copper over the past 5-years and why price action of late might be something one might not want to hide from–

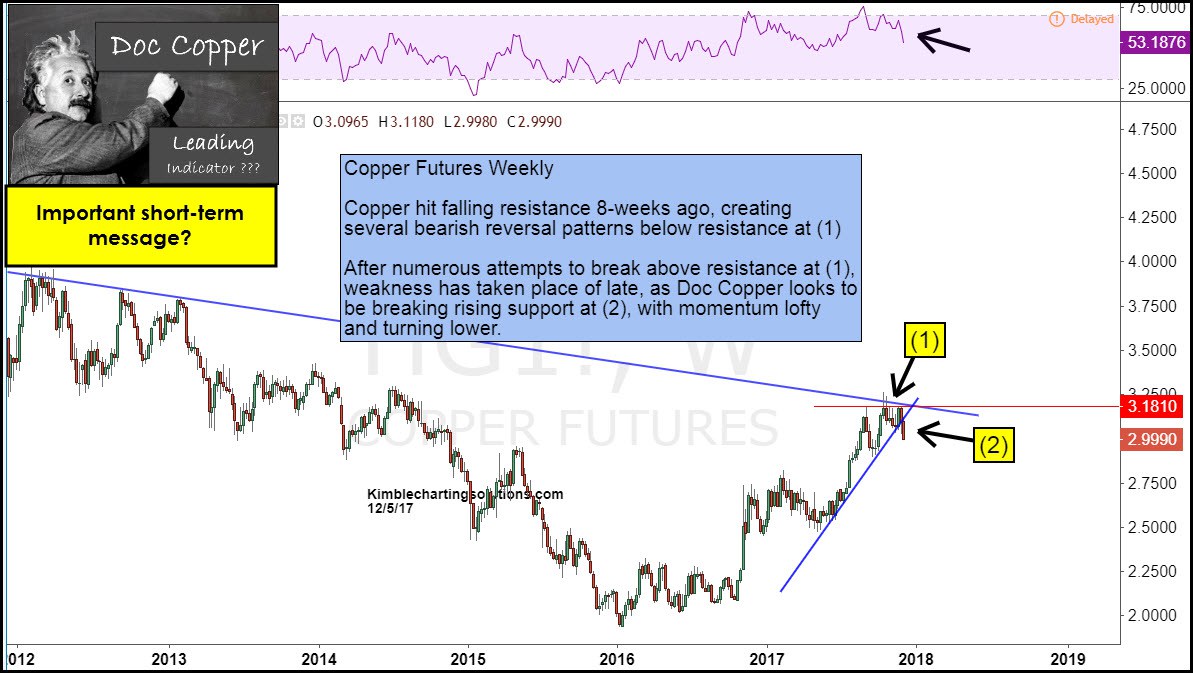
CLICK ON CHART TO ENLARGE
The 24-month counter-trend rally took Doc Copper to test 5-year falling resistance at (1), where it attempted three times to breakout.
While attempting to breakout, Doc Copper created several bearish wicks (bearish reversal patterns) at (1).The rally pushed momentum to the highest levels since the 2011 peak of late, which looks to be turning lower.
Doc Copper this week, could be breaking 6-month rising support at (2).
Time will tell if ole Doc Copper is sending an important global macro message to stocks and about global inflation or lack of. Stick your head in the sand and ignore the message from Doc Copper? I am not at this time.
Chart pattern analysis with brief commentary:
There is a ton of news and opinions about markets and stocks that make the decision-making process more difficult than it needs to be.
I believe the Power of the chart Pattern provides all you need to see what is taking place in an asset and determine the action to take.
This approach has worked well for me and our clients and I encourage you to test it for yourself.
Send an email if you would like to see sample research and take me up on a trial of our Premium or Weekly Research where I provide actionable alerts on breakouts and reversals in broad market indices, sectors, commodities, the miners and select individual stocks
Email services@kimblechartingsolutions.com
Call us Toll free 877-721-7217 international 714-941-9381
Website: KIMBLECHARTINGSOLUTIONS.COM
Receive daily research I post on the blog each day