Submitted by Lance Roberts via RealInvestmentAdvice.com,
As we conclude week two of the new Presidential cycle, it certainly has not been dull.
The markets have started struggling with an Administration which is hanging up on heads of state, threatening to send troops to Mexico, discussing border taxes and thinking about doubling the required wages for HB-1 visas.
Of course, those issues are still currently offset by hopes for a sea of infrastructure spending, tax cuts and reform and an increase in jobs and wages.The “hope” is most clearly seen in the sentiment surveys, but remains elusive in the “hard data.” As noted recently by Charlie McElligott via RBC:
“The US data has been running at such a clip, as a matter of fact, it’s an increasingly (and massively rhetorical) popular question asked by clients: when do analyst / strategist expectations begin to overshoot?
Tied-into this, the Bloomberg ‘econ surprise’ series gives an interesting breakout of the drivers of the directional data surprises, and it crystalizes one ‘area’ that Mark Orlsey and I have been paying a lot of attention to with regards to where the largest ‘beats’ are coming from.
The economic surveys and ‘animal spirits’ indicators have been ‘en fuego’ (see Friday’s U Mich Confidence printing highs since 2003!), and the chart below captures just how much of the ‘surprise index’ upside that surveys have been dictating – it’s visually stunning, and reiterates that ‘rubber needs to meet road’ in coming months.“

We can see this more real time by looking at the Chicago Fed National Activity Index (CFNAI) which is arguably one of the more important economic indicators. The index is a composite made up of 85 subcomponents which give a broad overview of overall economic activity in the U.S. However, unlike backward-looking statistics like GDP, the CFNAI is a forward-looking metric that gives some indication of how the economy is likely to look in the coming months. Importantly, understanding the message the index is designed to deliver is critical. From the Chicago Fed website:
“The Chicago Fed National Activity Index (CFNAI) is a monthly index designed to gauge overall economic activity and related inflationary pressure. A zero value for the index indicates that the national economy is expanding at its historical trend rate of growth; negative values indicate below-average growth, and positive values indicate above-average growth.“
The overall index is broken down into four major sub-categories which cover:
- Production & Income
- Employment, Unemployment & Hours
- Personal Consumption & Housing
- Sales, Orders & Inventories
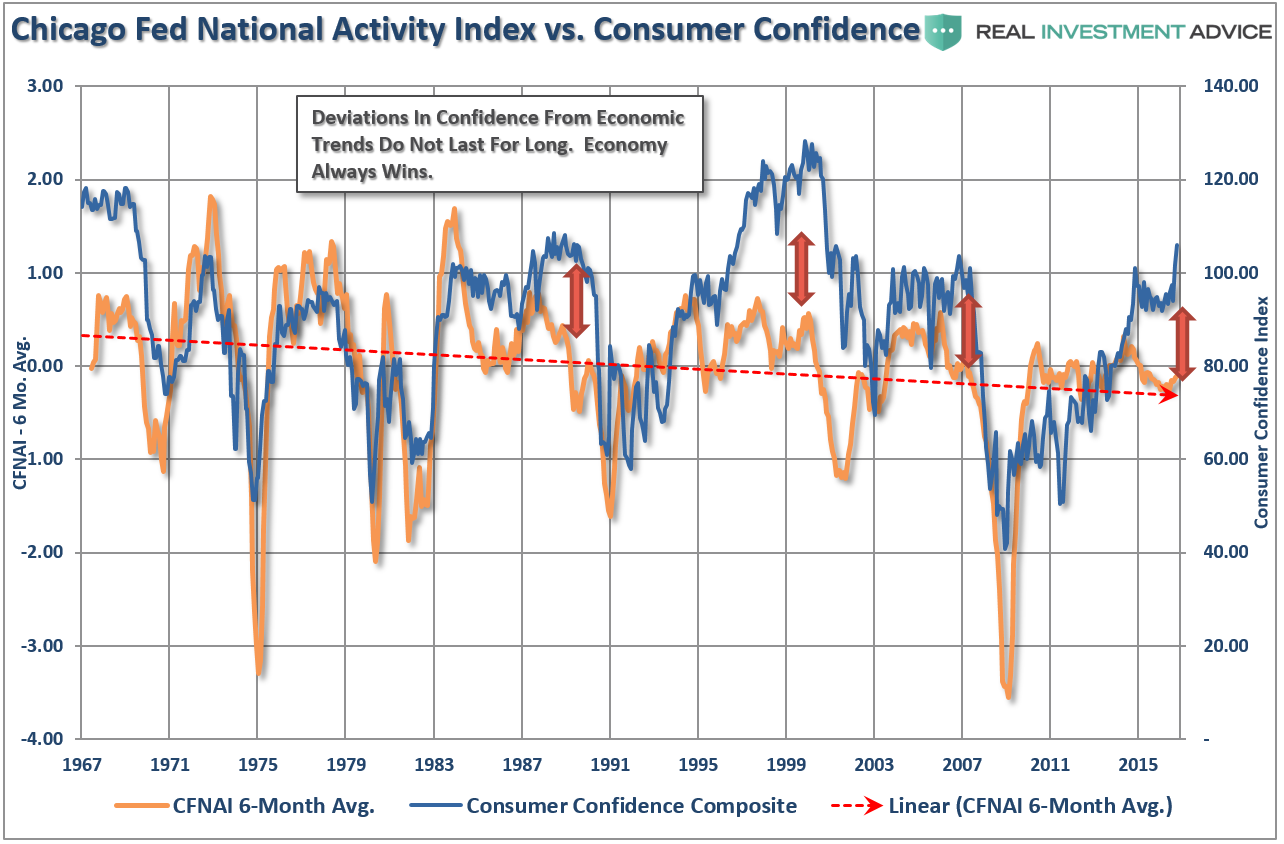
Here is my point. While “exuberance” in terms of “attitudes” is surging, actual activity remains quite subdued. The first chart compares my combined consumer confidence composite to the CFNAI.
The next chart is the dispersion of the components of the CFNAI also compared to consumer “confidence.”
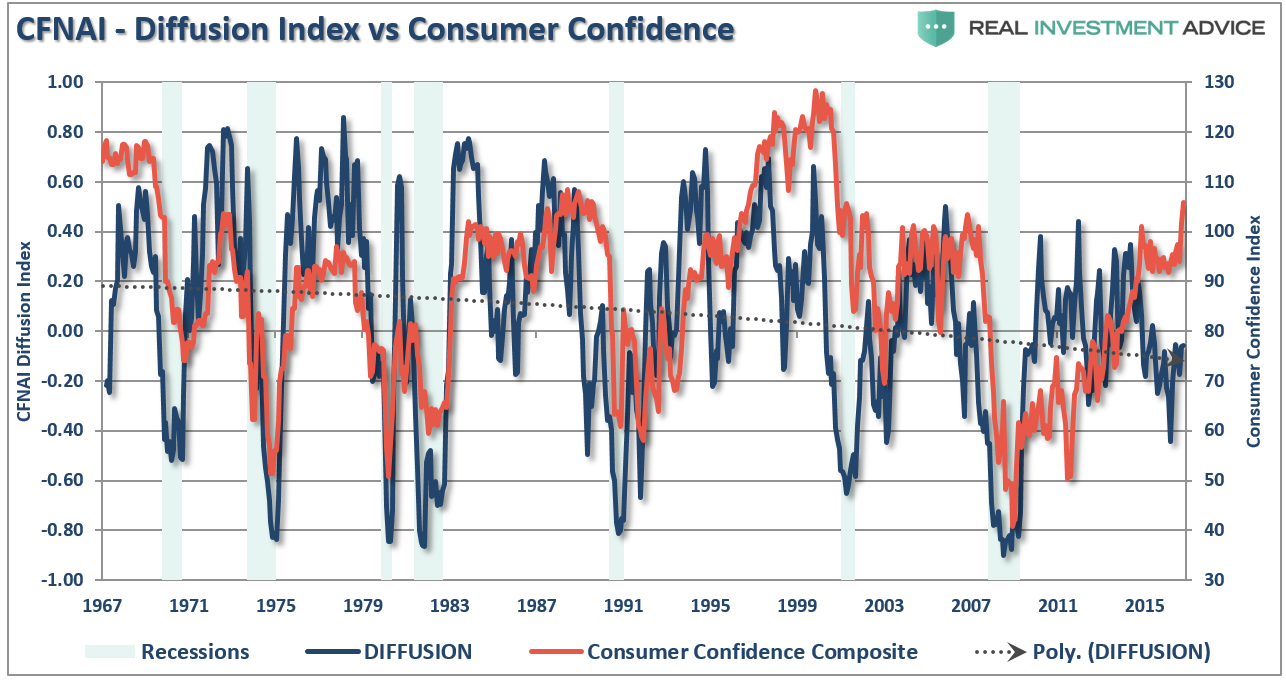
In both instances there is a wide deviation between “attitude” and “activity.” More importantly, “attitudes” have typically reverted back to “activity” rather than the other way around.
This potentially leaves the market set up for disappointment in the months ahead. Be careful.
In them meantime, here is what I am reading this weekend as I put my “Dow 20,000” hat back in the drawer for now.
Trump/Economy
- Peril In The Casino – You’re Fired by David Stockman via Daily Reckoning
- The Vampire Squid Is Back by Nomi Prins via The Daily Reckoning
- My Trump Bubble Bursts by John Stossel via Reason.com
- Trump & Trade by Eduardo Porter via NY Times
- Optimistic Growth Forecasts Miss The Risk by Ashoka Mody via Project Syndicate
- The Left Underestimates Trump’s Plans by Tyler Cowen via Bloomberg
- Fed Rates Hikes May Haunt Trump by Paul La Monica via CNN Money
- Border Tax May Backfire On Economy by Brad McMillan via Commonwealth
- Sharing Economy: Does It Create Real Jobs? by Shellie Karabell via Forbes
- Biggest Test For Trump Is Trump by Matt Egan via CNN Money
- What Happens Next May Scare You by Lawrence Summers via Wonkblog
- Trade Is Not The Driver Of Job Loss by Robert Samuelson via Real Clear Markets
- Trump Tweets Won’t Stop Job Departure by Justin Wolfers via NYT
- So Goes Tax Reform, So Goes The Nation by Ernest Christian via IBD
Markets/Fed
- Fed: The Cash Menagerie by Danielle DiMartino-Booth via Money Strong
- The Bond Bull Isn’t Dead Yet by Jim Rickards via The Daily Reckoning
- Everything You Know About Bonds Is Wrong by Sid Verma via Bloomberg
- The Stock Market Bubble Is Inflating by Michael Sincere via MarketWatch
- 3-Trends Point To Stock Upside by Sue Chang via MarketWatch
- The Honeymoon Is Over by Tim Mullaney via MarketWatch
- Wall Street Faces Rude Awakening by Matt O’Brien via Wonkblog
- Phase 3 Of The Trump Rally by Mohamed El-Erian via Bloomberg
- Has The Love Affair Already Ended? by Anthony Mirhaydari via Fiscal Times
- Don’t Worry About Bond Pullback by Simon Constable via US News
- Trump Will Market Uncertainty Great Again by Doug Kass via Real Clear Markets
- Is The Trump Rally Over Already by Edward Harrison via Credit Writedowns
- Dow 20,000 Running On Fumes by Kenneth Rapoza via Forbes
- How To Confuse The Markets by Buttonwood via The Economist
Favorite / Interesting Reads
- Countries Where Millennials Will Support Parents by Tyler Durden via ZeroHedge
- Will Trump’s Walls Literally Divide Us by Caroline Baum via MarketWatch
- America’s Declining Dynamism by The Economic Innovation Group
- The Delusion Of Wind/Solar Salvation by Gail Tverberg via Our Finite World
- America’s Student Debt Problem Larger Than Imagined by Shaun Bradley via TheAntiMedia.org
- Retirement: $350k For Healthcare? by Robert Powell via MarketWatch
- Apple’s Results Worse Than You Think by Thomas Kee via MarketWatch
- Surviving The next Housing Market Crash by Mark Roe via Project Syndicate
- America’s Great Divergence by Alana Semuels via The Atlantic
- The $60 Billion Euro Brexit Battle by Mark Gilbert via Bloomberg View
- Millennial’s Doing Worse Than Boomers by Jim Probasco via Investopedia
- Earnings Are Still A Confusing Mess by Clara Linnane via MarketWatch
- Watch Out FedEx, Amazon Is Coming After You by Tyler Durden via ZeroHedge
- Harry Dent: A 70% Correction Is Coming by Adam Taggart via Peak Prosperity
- The Case For A 50% Correction by John Hussman via Hussman Funds
- So Goes January, So Goes The Year? by Dana Lyons via Tumblr
- The Unintended Consequences Of QE by Jesse Felder via The Felder Report
“Bubbles Are Invisible To Those Inside The Bubble.” -? Jim Dines
