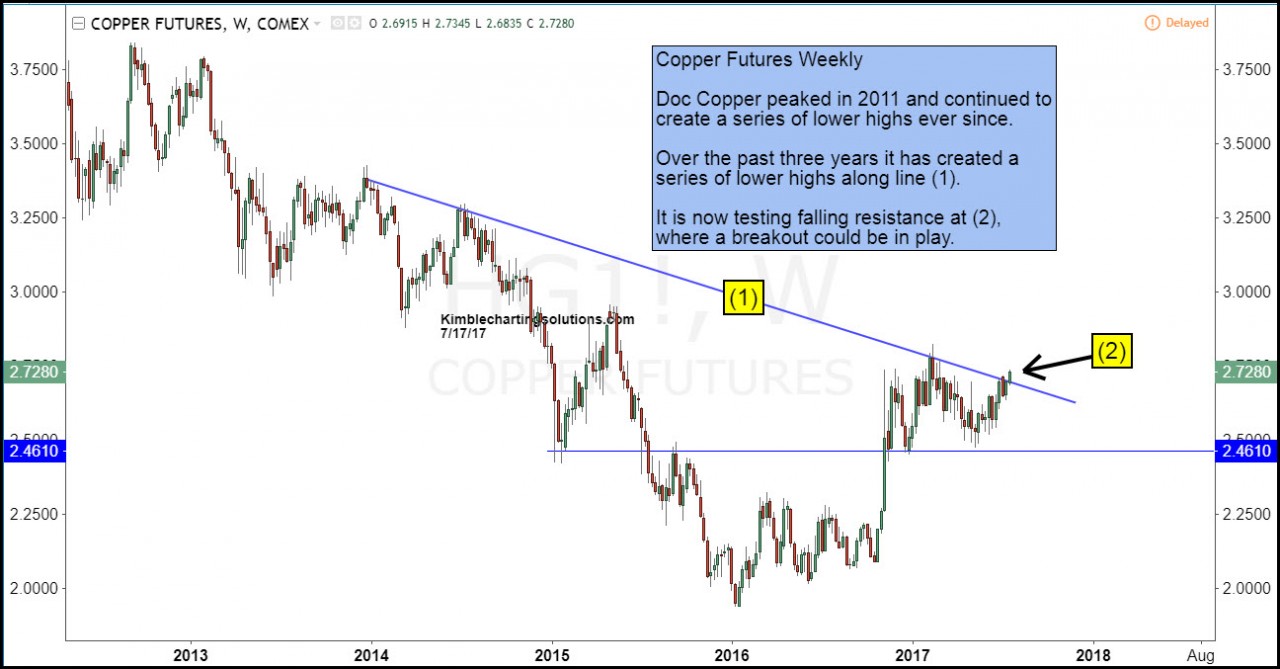
Ole Doc Copper has had its head in the sand over the past 6-years, creating lower highs since 2011. Over the past three years it also has created another series of lower highs reflected in the chart below. Doc Copper could be attempting to do something it hasn’t for years in the chart below.

CLICK ON CHART TO ENLARGE
A breakout attempt could be in play this week, as Doc Copper is testing falling resistance line (1) at (2).
A breakout here and above highs hit earlier this year, would send bullish message to Copper.Copper can be played in a few ways, with our favorite being Freeport McMoran (FCX). Below looks at the performance of FCX since Premium & Metals Members bought FCX on May 19th.

CLICK ON CHART TO ENLARGE
Over the past 60-days (since FCX) was purchased it is gained nearly 7% more than the S&P 500 and 13% more than Gold miners GDX.
This information is coming to you from Kimble Charting Solutions. We strive to produce concise, timely and actionable chart pattern analysis to save people time, improve your decion-making and results
Send us an email if you would like to see sample reports or a trial period to test drive our Premium or Weekly Research
Website: KIMBLECHARTINGSOLUTIONS.COM
Questions: Email services@kimblechartingsolutions.com or call us toll free 877-721-7217 international 714-941-9381